A glance at the table below confirms that year over year statistics are overwhelming the monthly numbers. Buyers were out there buying in March, and they were buying more than they did in February, which was up from January. That’s to be expected. We report actual numbers, as opposed to “seasonally adjusted,” so coming from the depths of winter into spring always increases real estate activity.
Because of that simple fact, the year over year statistics are far more important as an indicator of where the market may be headed. The big increase in March sales doesn’t offset how far down sales volume has gone since last year. Nor does it hint at the level to which median prices are taking a hit.
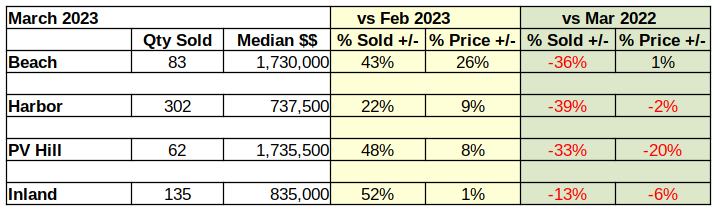
Compared to last year, sales volume is off by a third in nearly all areas of the Los Angeles South Bay. Median prices haven’t dropped nearly as large a percentage, but we can clearly see the direction. The Federal Reserve System (Fed) comment in the April “Beige Book” said it all: “Residential and commercial real estate activity fell, and lending activity declined substantially.”
Beach Cities Median Still Rising
As the over-all real estate market begins a dive into the depths of a Fed-induced recession, we find the Beach Cities as the only remaining local market with year-over-year positive median price growth. It’s not much. A mere 1% growth over March of 2022 is hardly an investment recommendation, especially with inflation running around 6%. And, the rest of the Los Angeles South Bay is already negative compared to this time last year.
This is the second time in 2023 buyers at the Beach have nudged the median price up while the rest of the residential market fell. January showed a 6% increase which collapsed February in a 17% free fall. February’s dismal numbers contributed to what looks like a good March in the month to month measurement.
Staying positive in March appears to be predominately the result of a single sale in Hermosa Beach. At nearly 5000 sq ft, with stunning ocean views, the property was bid up from its $5M dollar list price to just over $6M, closing with a cash offer in only 12 days. Without that transaction the Beach Cities marketplace would have stood at 0% growth.
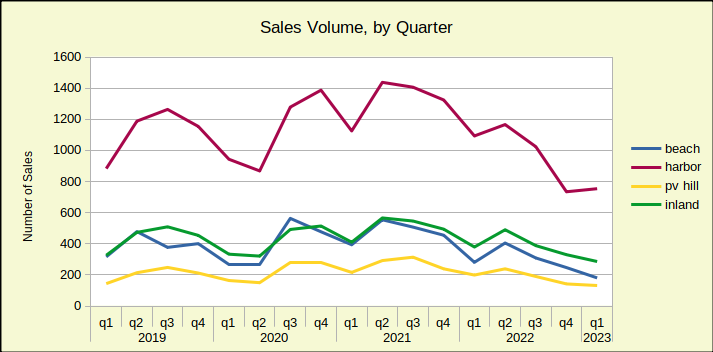
The big story at the Beach is the sales volume versus the most recent “normal” year of real estate business. The chart below shows the number of homes sold in each of the South Bay areas, with seasonal shifts.
Notice that 2019, the last normal year, begins low, with few sales in the winter months. Sales peak in quarter three, in the heat of summer, then decline back down to about where they started.
Compare that to what happened in 2022, when everything seemed to head down.
Only 83 homes were sold in March of this year, and only 181 homes sold across the first quarter of 2023. In 2019 the area averaged monthly sales of over 100 units; approximately 425 homes per quarter. That amounts to a 43% decline in the number of sales compared to pre-pandemic levels.
As this is written there are 152 homes available in the Beach Cities with an average of 62 days on market. Both, the level of inventory and the time on market are increasing daily. Those factors, especially working together, will cause price decreases. With a constantly increasing mortgage interest rate, there’s little doubt the valuation gains of the pandemic era will not hold up to the recession in the world of real estate.
Harbor Area Sales Volume Plummets 39%
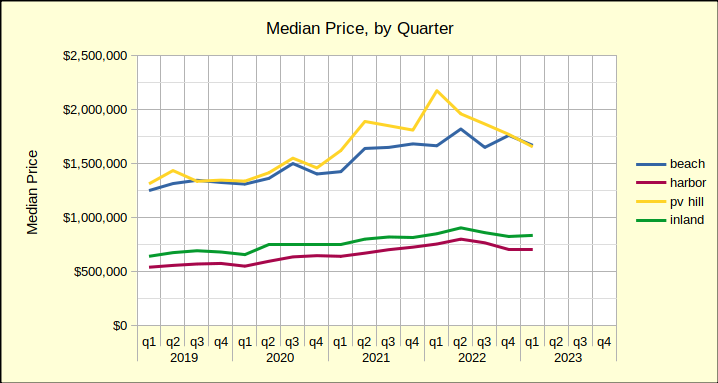
The Sales Volume, by Quarter chart above shows relatively synchronous movement across time by three of the four areas. The fourth area, the Harbor, floats at the top of the sales volume chart. Similarly, the Harbor area sinks to the bottom of the median price chart.
Homes in the Harbor area are typically what’s known as “entry level.” They are small homes, often condominiums, and are priced at the bottom of the scale. These are the homes newly wed couples buy, and the homes that house growing families. They are the type of properties occupied by most Angelenos, whether they be homeowners or tenants.
None of that explains the huge swings, though. What does is family economics—cash flow. When both prices and interest rates are low, the entry level market sings. When the cost of home ownership rises, this is the first area to fall and it usually falls the deepest. March sales across the Harbor dropped by 39% from March of 2022. At the same time median pricing at the Harbor dropped 2%–not nearly enough to offset interest rates that are running in the 6%-7% range. Until the mortgage interest rate goes down, or the asking price drops, or both, this market is going to be slow.
Inventory is currently 336 homes on the market, with time on the market averaging 60 days.
Median Down 20% for Homes on the PV Hill
Even more volatile than the Beach, homes on the Palos Verdes Peninsula dropped over a half million dollars in median price from the first quarter of 2022 to the first quarter of 2023. That steep yellow line on the chart below shows the downward direction of home prices in the area. Interestingly, the Beach Cities and the PV Hill declines have been almost exactly the same for the past 90 days.
As noted above, the Peninsula, with its large lots and relatively few homes, invariably shows a lot of volatility. The 20% drop in year over year median price is matched by a 33% drop in sales volume since March of 2022. Much of the median price increase seen last year resulted from a series of new construction sales. Those newly built homes came in at top dollar and helped elevate the median price nicely.
Builders are now anticipating a long, slow recession/recovery, so the PV market is not likely to see that benefit come back for a few years.
This newsletter focuses on residential, but it should be noted the Palos Verdes commercial marketplace has also taken a significant hit since the pandemic. Retail lease prices are at rock bottom and lots of space is available. It would not be surprising to see some of the older commercial space re-configured to meet residential needs. Such a transition could help the cities on the Hill meet their obligation to the State for additional residential construction to alleviate the housing shortage.
Inventory today shows 83 homes available, with an average time of 80 days on the market.
Stability Marks the Inland Area
The “family friendly” Inland Area is surrounded on three sides by the Beach Cities, PV Hill and the Harbor Area. It’s a quiet environment, usually without the drama and speculation found in the more upscale Beach and Hill areas. Anchored by Torrance, the market direction is normally the same as the rest of the South Bay, without the more radical ups and downs. March real estate activity reflected that nature in price and sales volume compared to March of last year.
The “Median Price by Quarter” chart above shows a year over year decrease of 6%, in keeping with annual results from the Hill and Harbor areas. The chart also shows a long, steady green line that doesn’t offer surprises, or dramatic movements in any direction. The current recession is expected to bring prices down somewhat, making the Inland area an excellent target for home buyers, or investors during the coming months.
Available as of this writing, are 130 homes. In keeping with the Inland image of slow and steady, the statistics still show only an average of 47 days on the market. Compare that to 80 on the Hill and 62 at the Beach. Buyers are more abundant here, as long as mortgage interest rates are affordable.
Footnotes
The areas are:
Beach: includes the cities of El Segundo, Manhattan Beach, Hermosa Beach and Redondo Beach;
PV Hill: includes the cities of Palos Verdes Estates, Rancho Palos Verdes, Rolling Hills and Rolling Hills Estates;
Harbor: includes the cities of San Pedro, Long Beach, Wilmington, Harbor City and Carson;
Inland: includes the cities of Torrance, Gardena and Lomita.
Photo by Rich Brents on Unsplash