In a normal year, the interest rate for a conventional mortgage loan would be lower than the rate quoted for a “high balance” loan, which would be slightly lower than a “jumbo” mortgage. (Here in Los Angeles jumbo is more common than not.) The theory behind the differing rates is one of risk management. Lenders generally consider larger loans to be more risky, thus jumbo costs more.
Guess what! It’s not a normal year. It’s a Presidential Election Year. In addition to the political strife, our nation is closely involved in a couple of economy-disrupting wars in other parts of the globe.
The end result is jumbo loans with fixed interest rates that are as low or lower than conventional loans. Despite headlines touting strength in the economy, interest rates have increased by approximately .5% since the first of the year. The most recent announcements from the Federal Reserve System are hinting that anticipated rate reductions aren’t happening at all in the first half of 2024, and the number of potential reductions is expected to be less than previously expected.
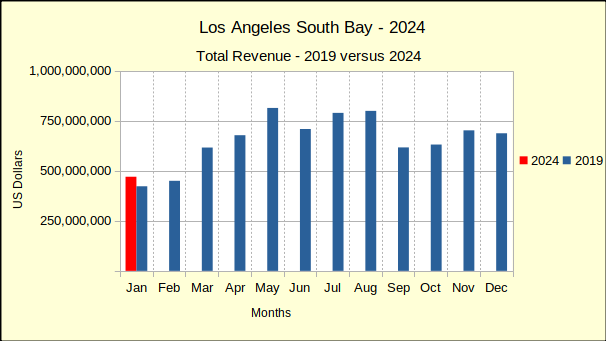
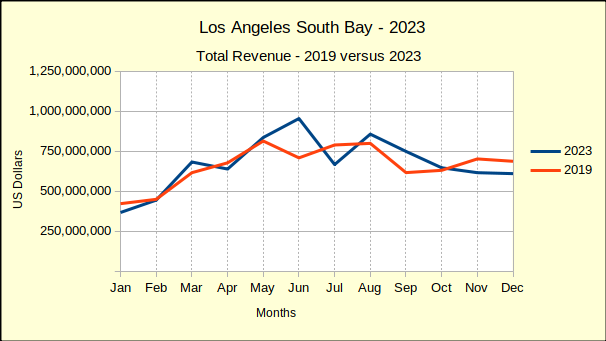
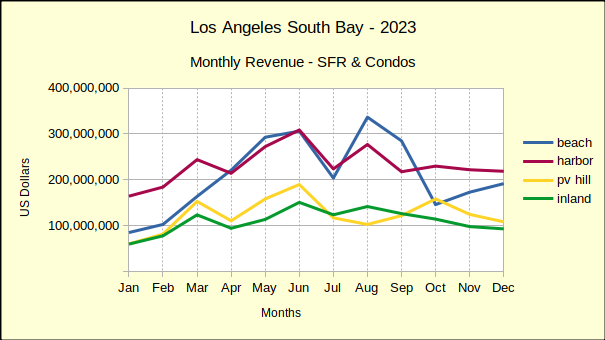
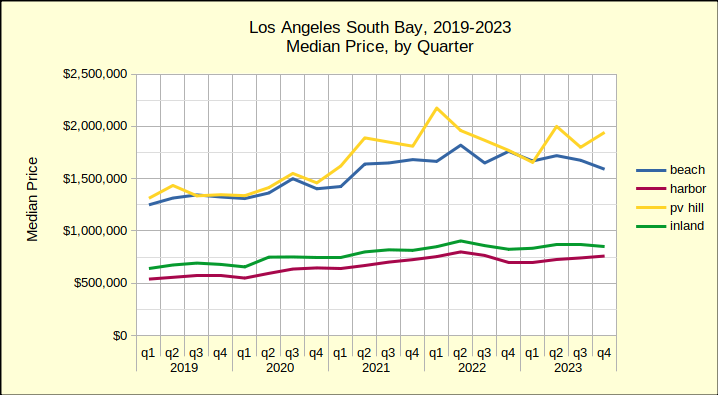
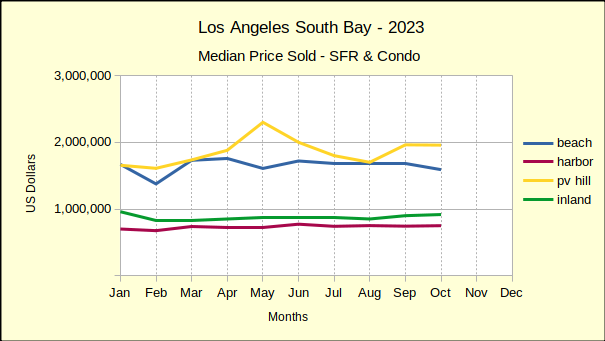
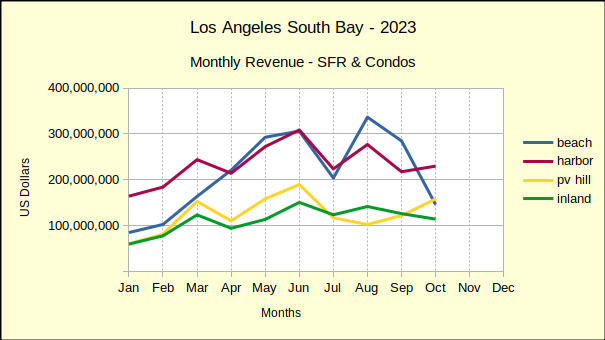
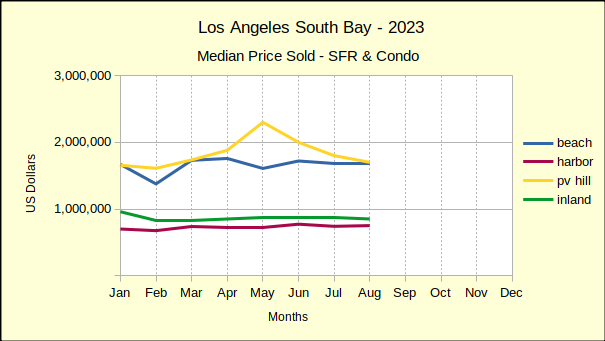
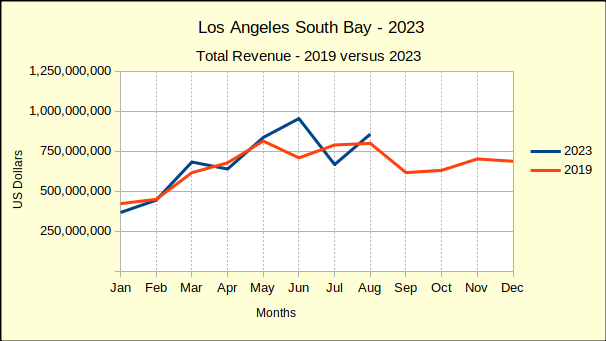
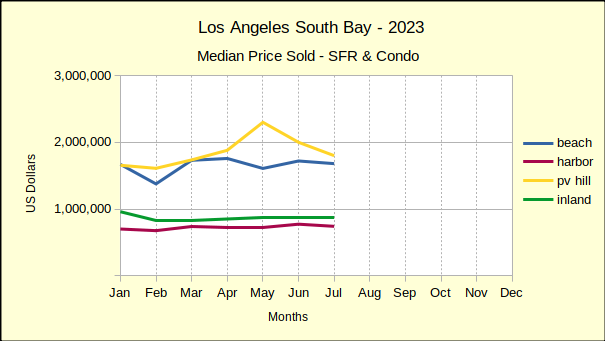
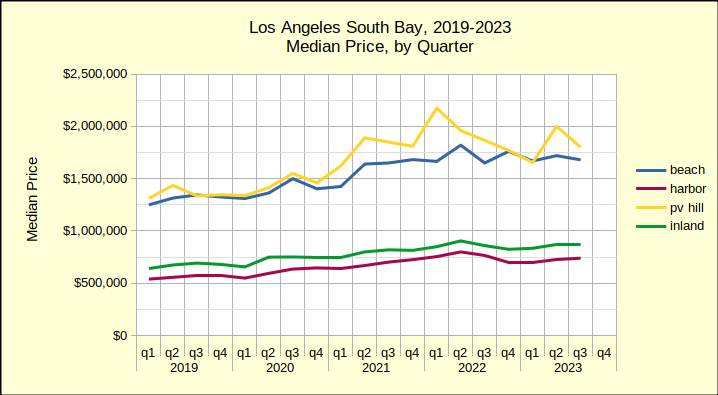
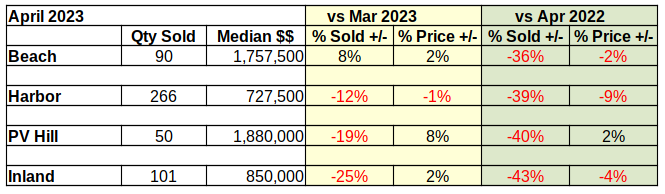
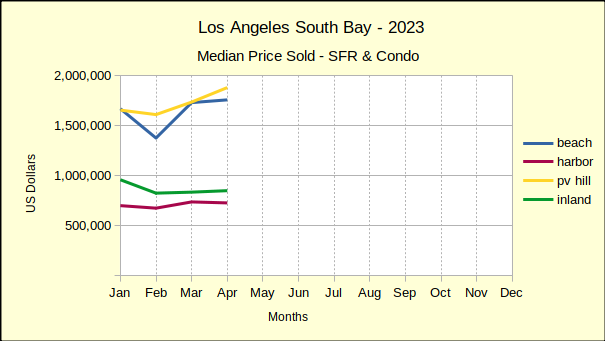
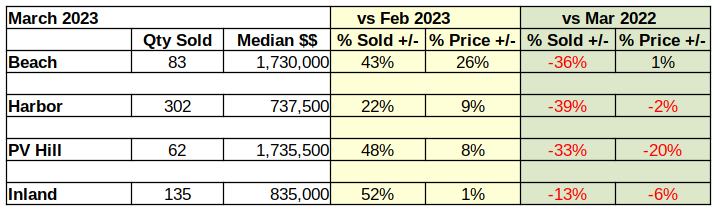
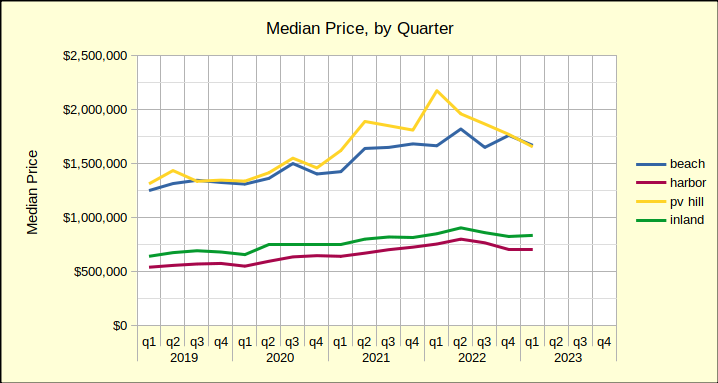
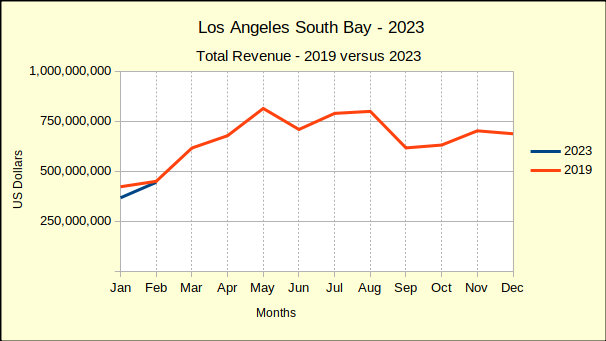
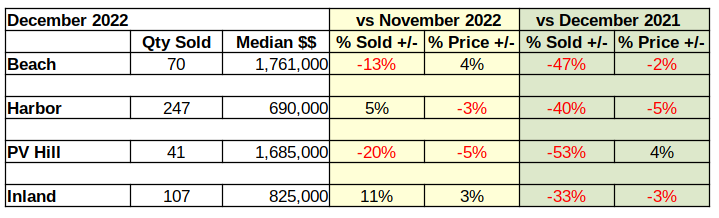
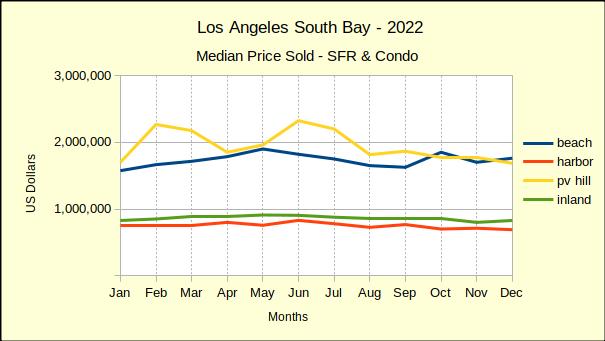
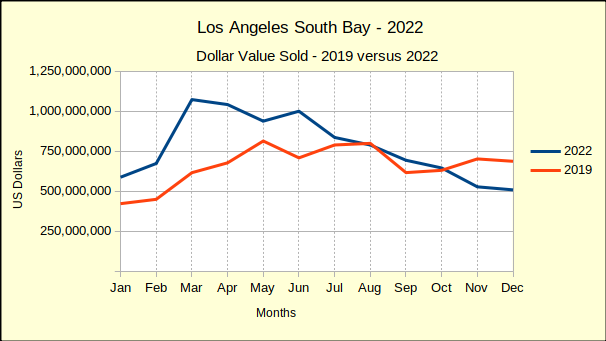
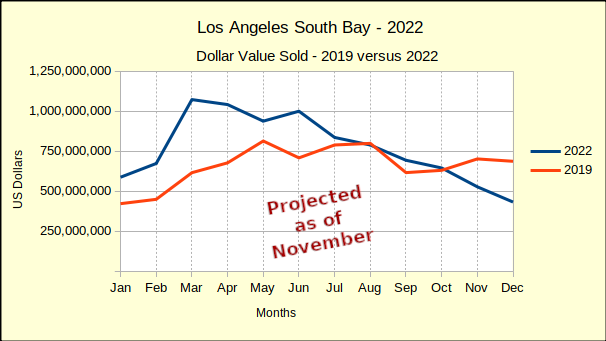
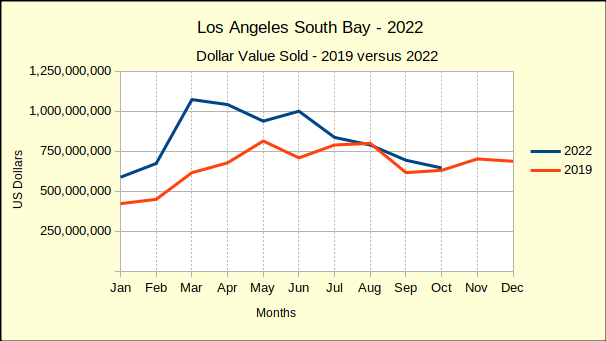
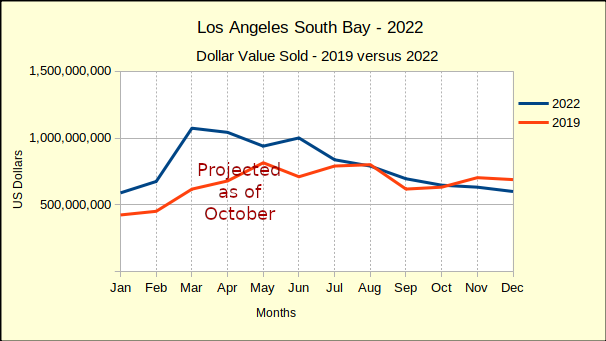
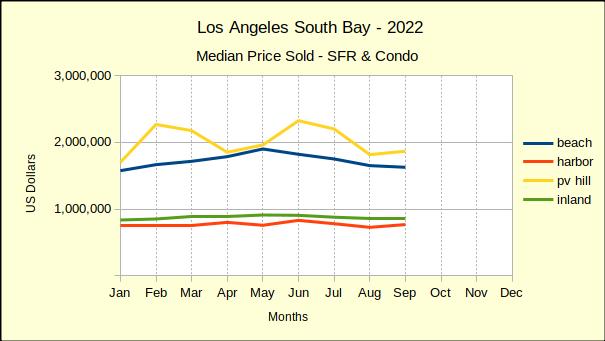
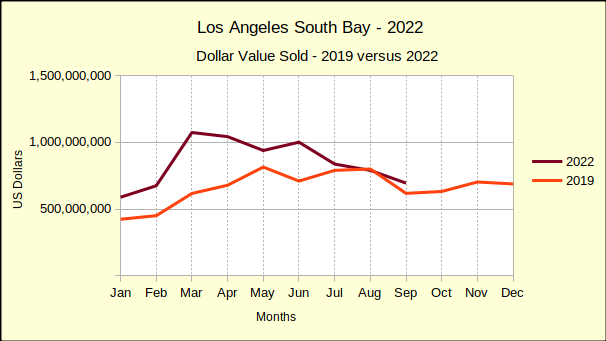
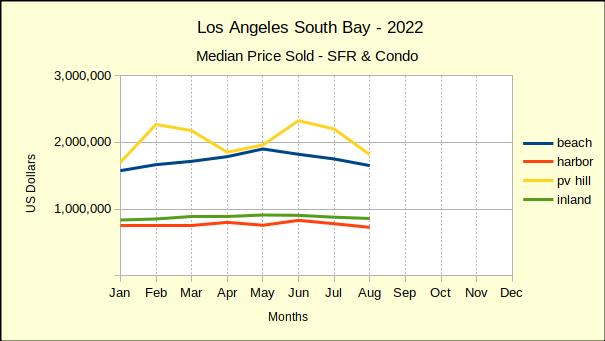
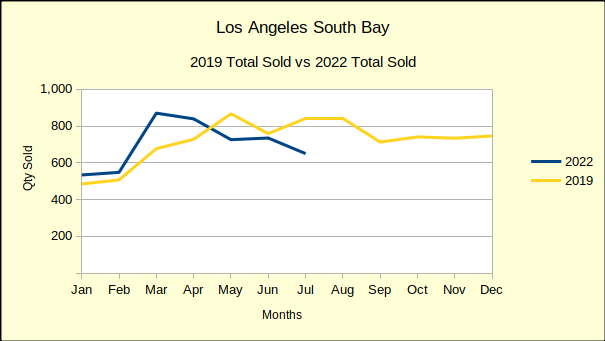
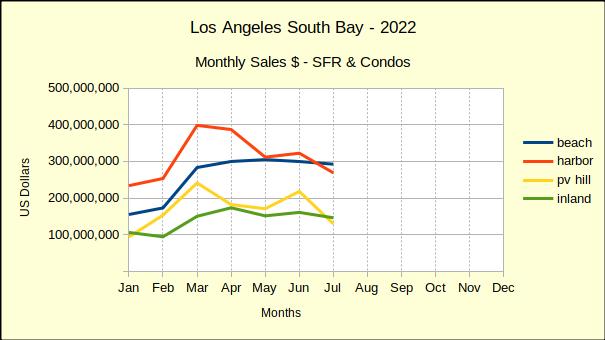
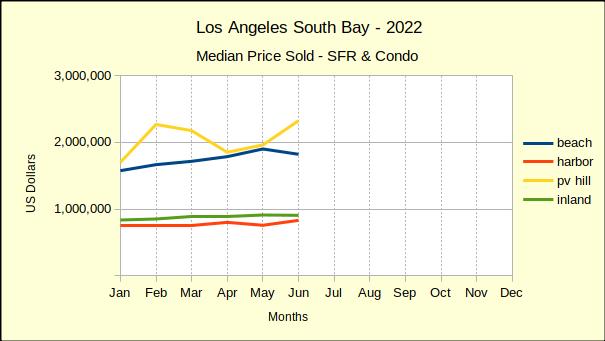
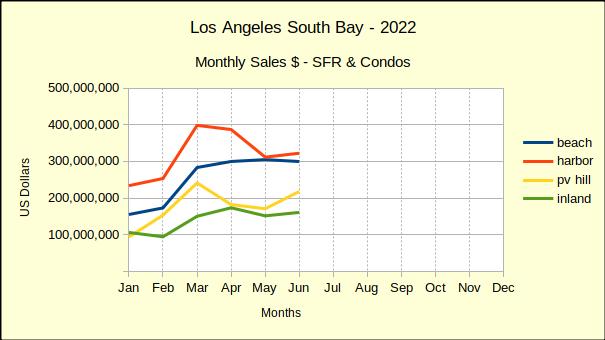
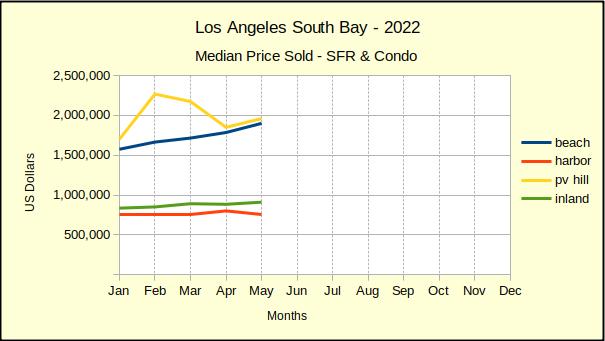
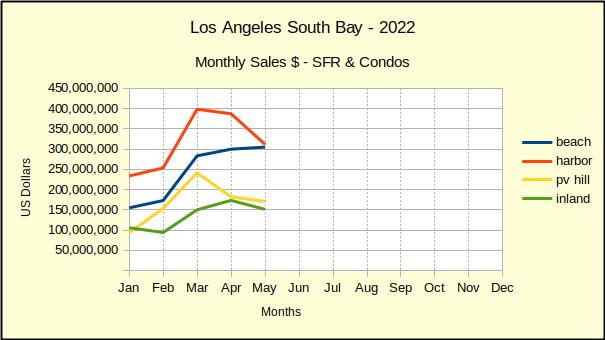
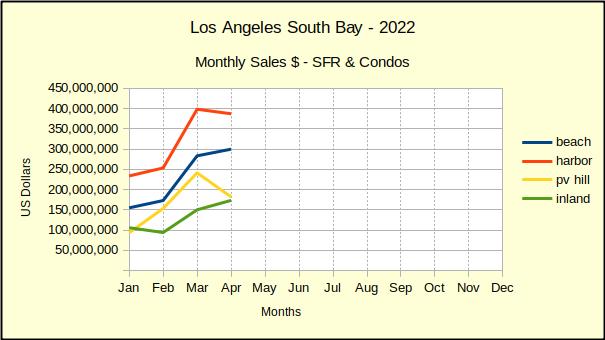
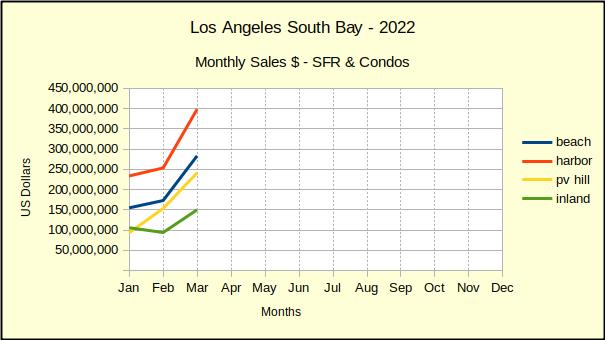
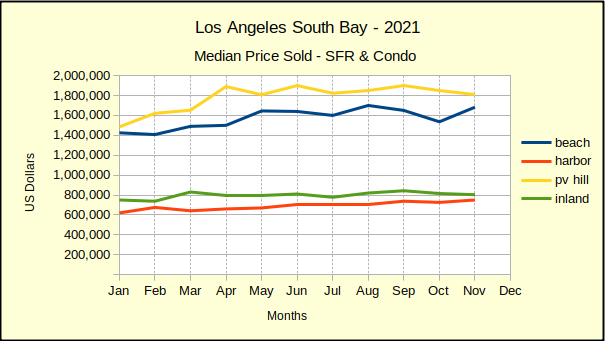
Last year saw median prices in the South Bay falling below 2022 prices through July. In August of last year price declines began to abate. By December of 2023 prices had started to stabilize. The new year continued that trend with only one negative median price result in January. Improving on that, February showed solid growth in prices across the South Bay. The real estate market seems to be reacting to what is touted as an improving economy.
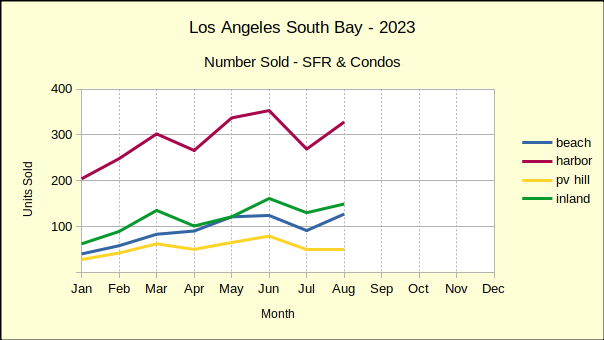
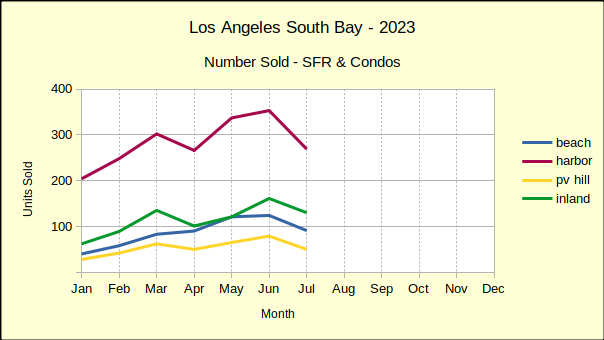
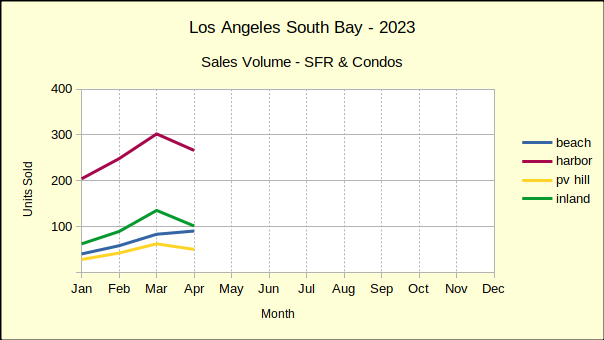
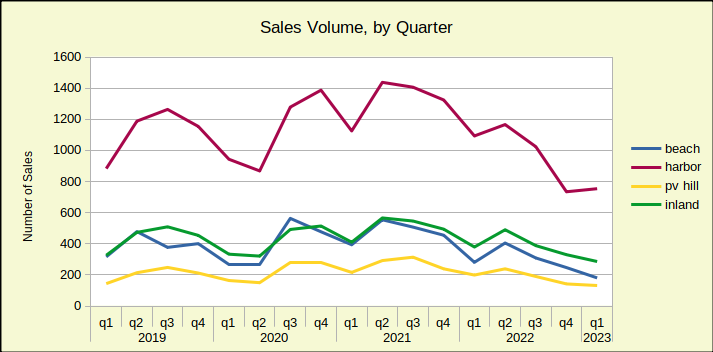
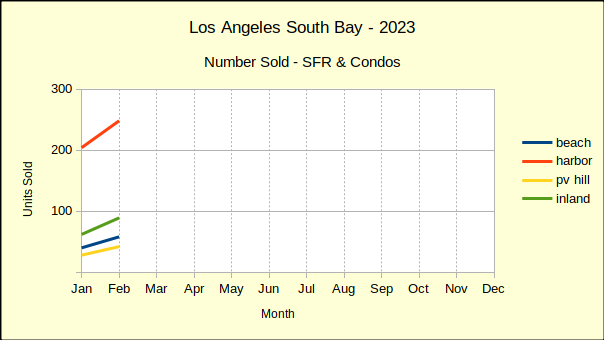
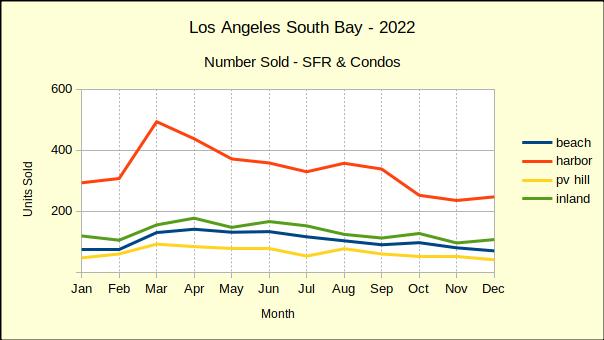
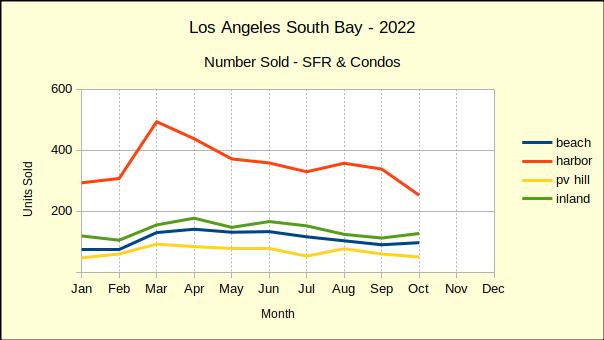
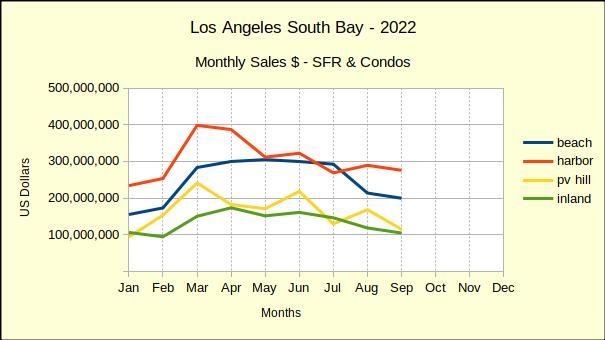
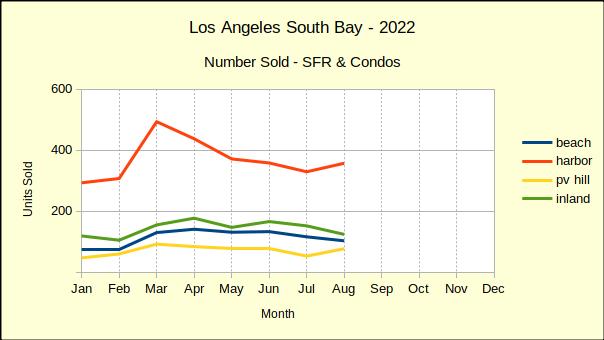
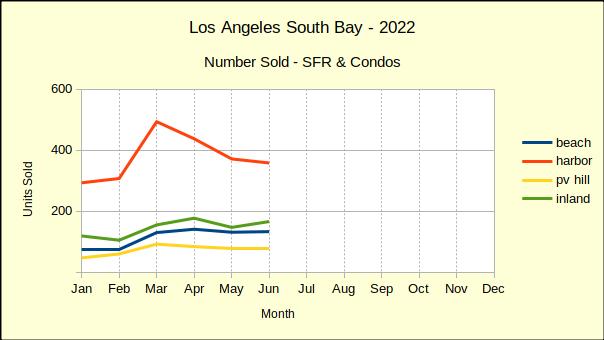
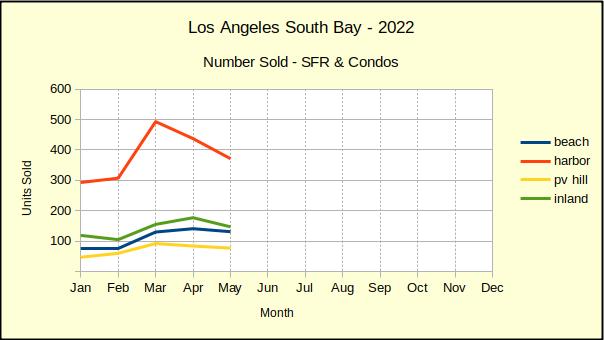
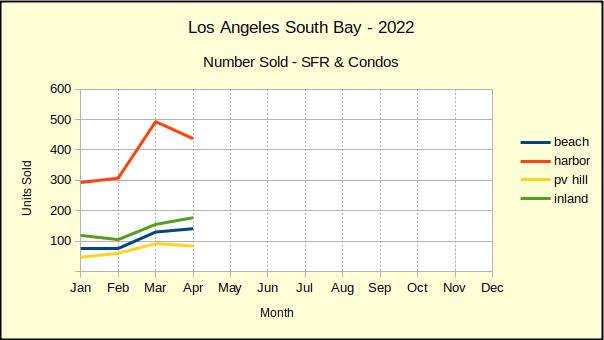
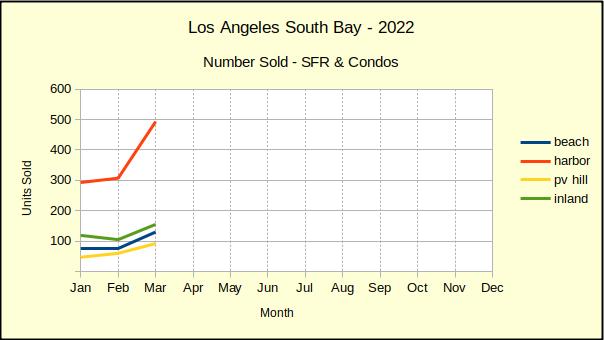
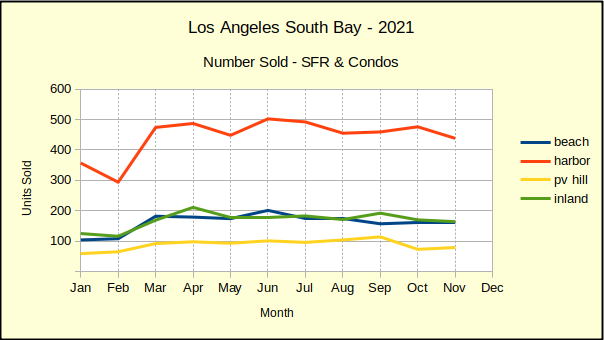
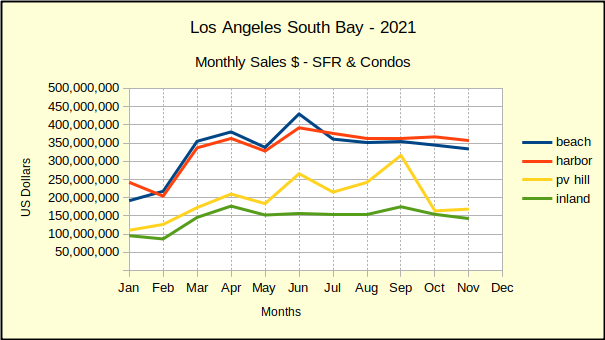
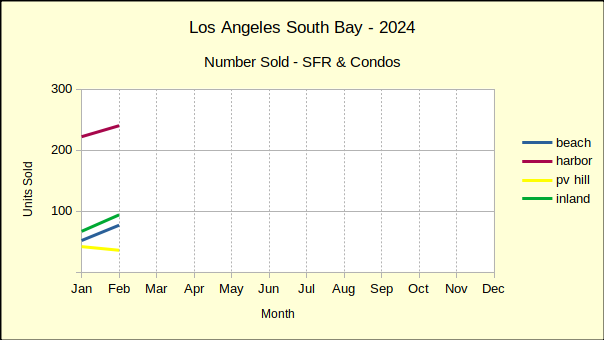
However, compared to last February, sales volume this February was a mixed bag with overall positive growth of 2% despite declines of 3% in the Harbor area and 14% on the Hill. These weaker sales figures follow a strong growth in the number of homes sold in January versus the same month in 2023.
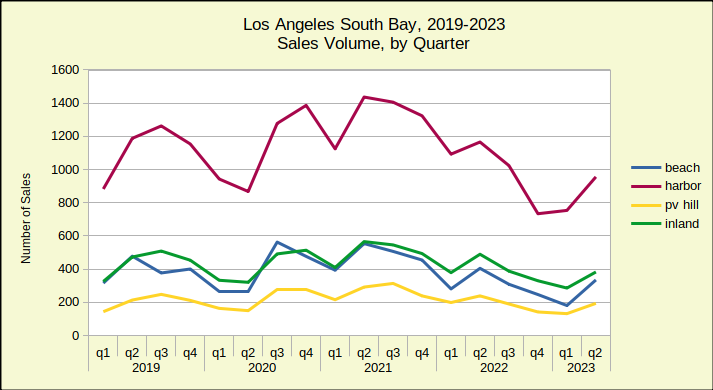
Recent month to month history has shown that a decline in sales volume is typically followed by a decline in median price. This “tit for tat” resonance indicates a market where buyers are at the edge of their ability to buy and sellers are feeling the resistance. Indeed, following the upward movement of mortgage interest rate activity for the first two months of the year leads to the conclusion sales volume will drop, followed by more substantial price decreases in coming months.
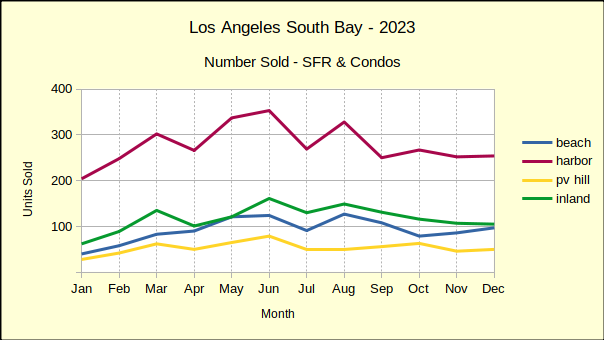
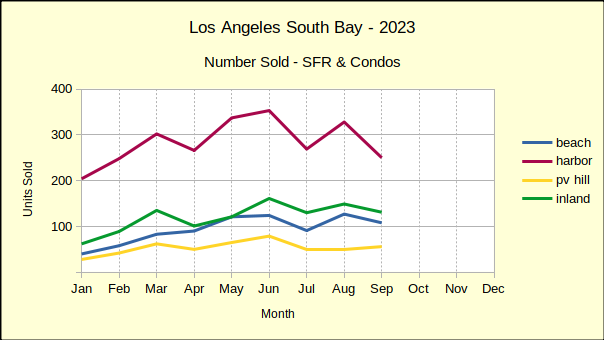
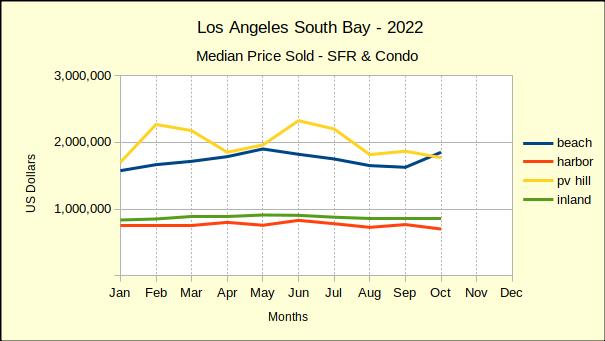
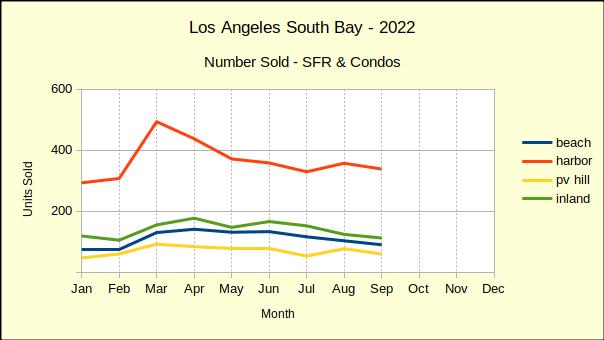
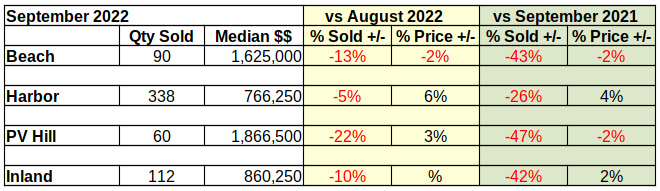
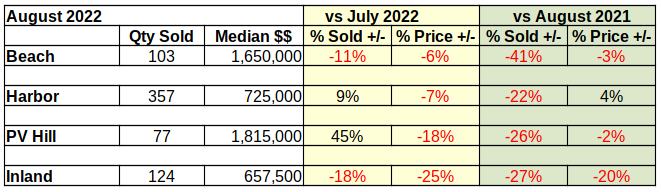
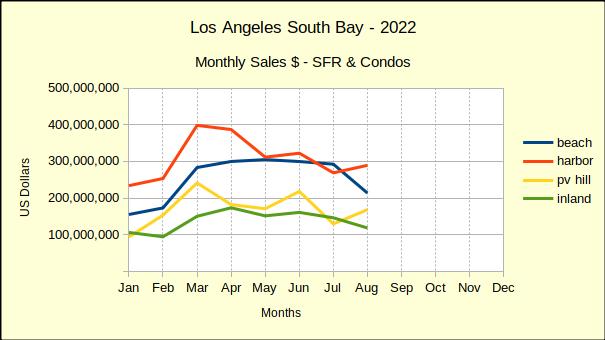
Beach: Sales and Prices SeeSaw
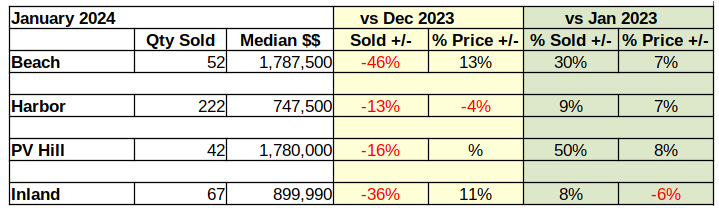
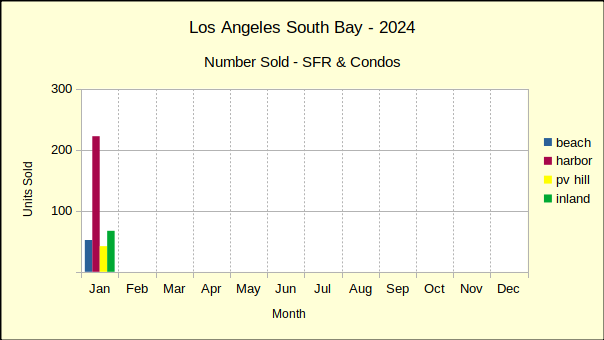
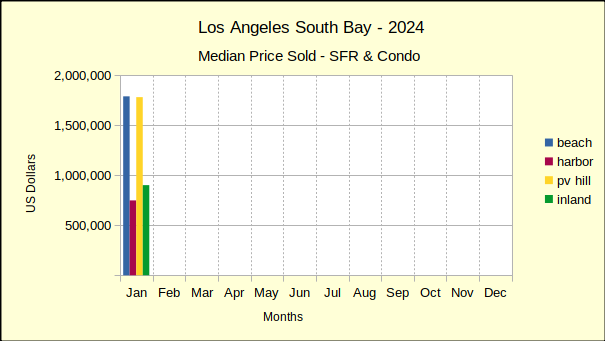
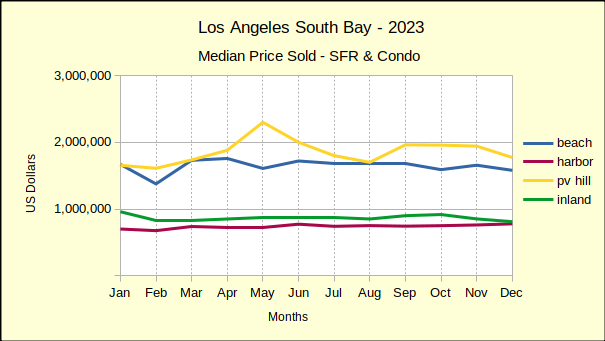
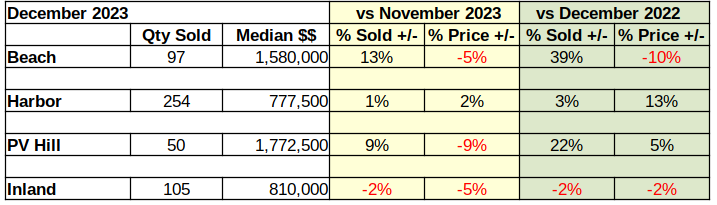
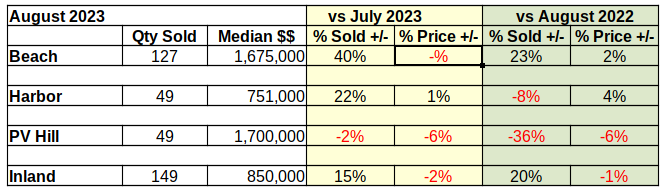
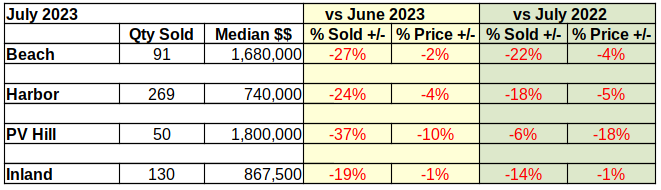
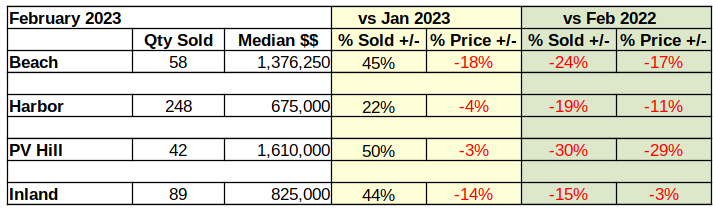
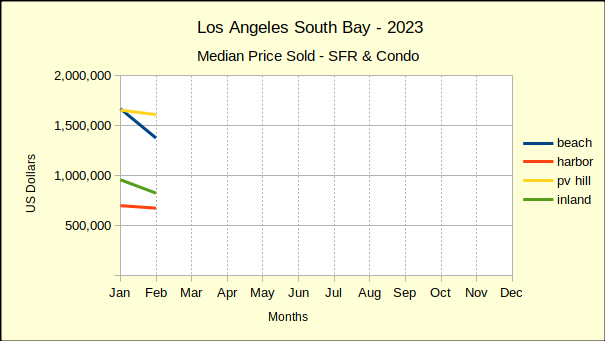
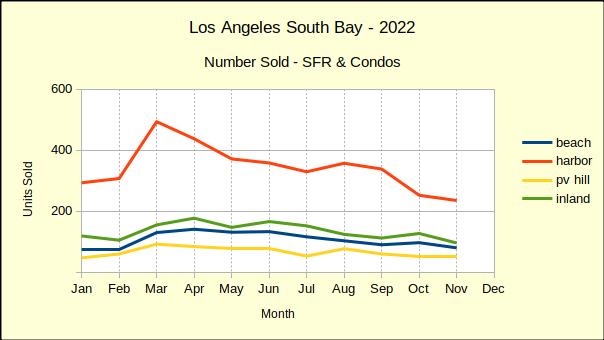
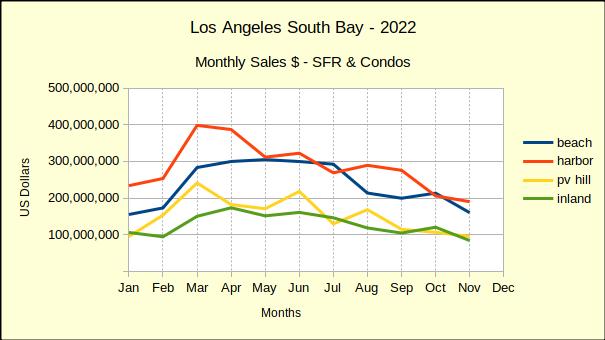
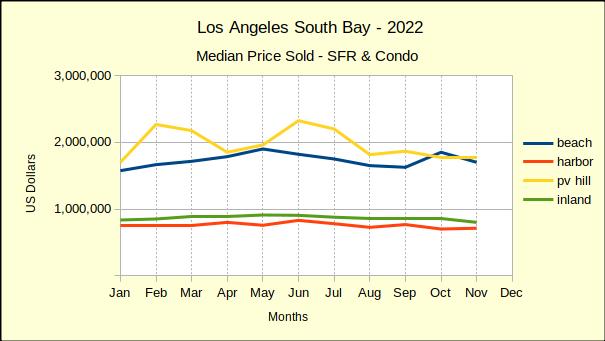
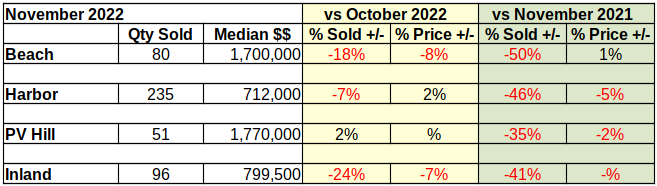
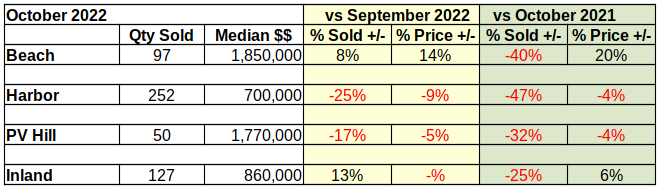
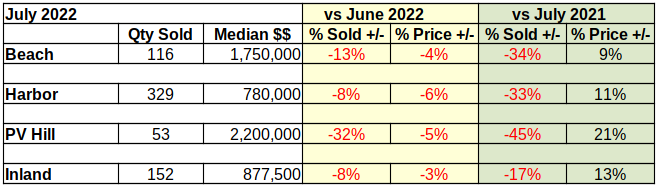
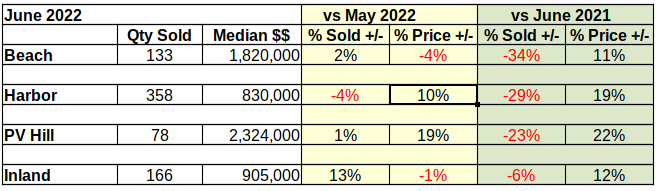
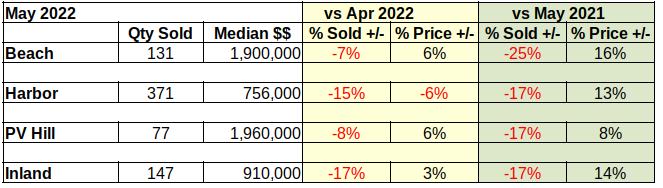
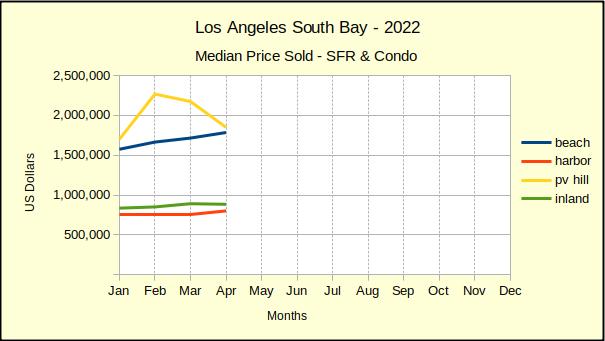
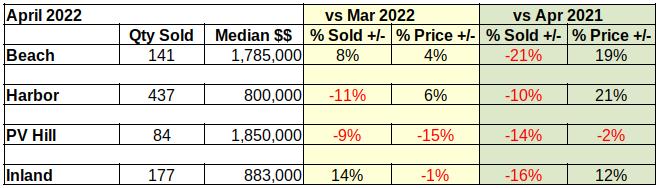
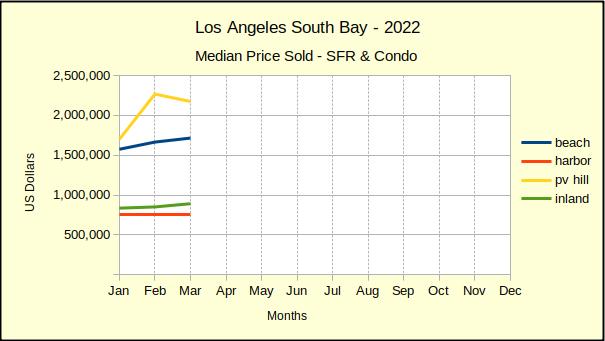
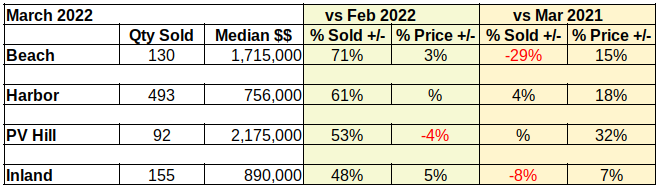
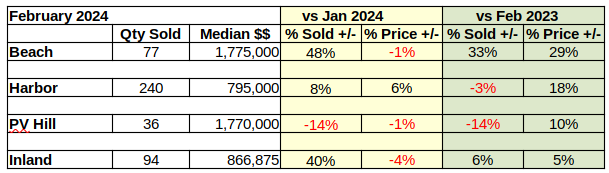
On a month to month basis, the Beach area has seen serious ups and downs in the number of homes sold and in the median sales price. January started with a massive 46% drop in sales from December, then February showed up with a 48% increase in sales volume. By way of contrast, Palos Verdes sales were down 16% and down 14% for the same months. The median price for Beach homes slipped 1% in February versus a 13% increase in January.
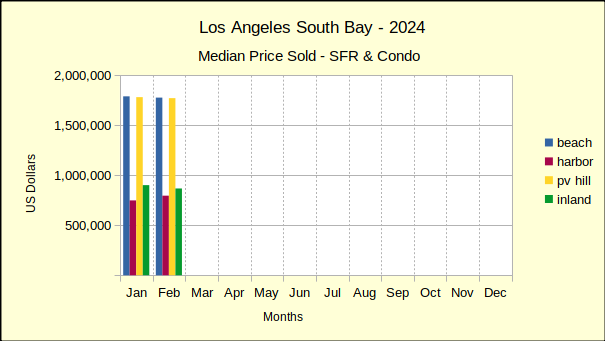
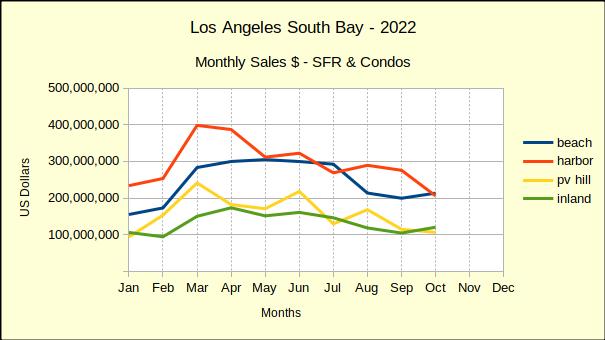
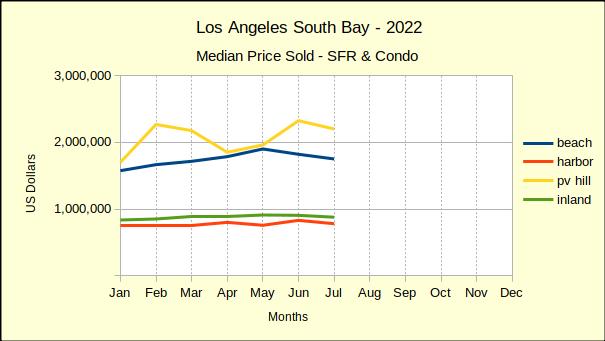
February sales volume versus February of 2023 was also steeply higher at 33%, the largest increase of the South Bay areas. At $1.175M the median price was up 29% over the same month last year. This is a somewhat surprising median price increase in light of other annual increases around the South Bay falling in the range of 5-18%.
Looking at year to date for the first two months of 2024, the Beach area had positive sales volume of 32% with a median price increase of 17%.
Harbor: More Up and Down
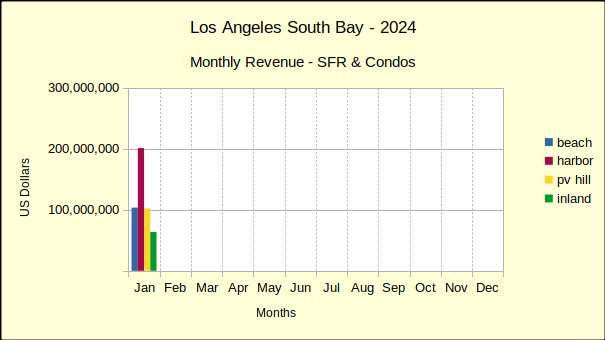
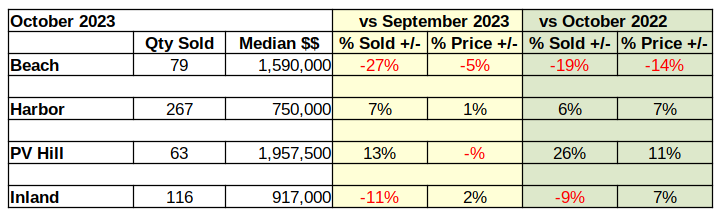
Responding to the volatility of the economy, the Harbor area flipped from negative numbers in January to positive in February. The number of homes sold was up by 8% over the prior month, while the median price of those homes increased 6%. The largest of the South Bay areas, the Harbor area typically has less variability in both sales and prices than the other areas.
Annual figures, looking at change from one year to the next in the same month, is usually a predictor of long term direction. February home sales in the Harbor area seem to be close to the bottom of market. Volume dropped by 3% from 2023, the smallest annual decline since the end of the pandemic.
At the same time, the median price rose 18% above that of February 2023. It should be noted that the median price in the Harbor last February was exceptionally low at $675K. In contrast, the $795K for this year appears to be on the high side and should be expected to moderate as the year goes on.
Year to date, the number of homes sold has increased by 2% over 2023. The median price has gone up 12%.
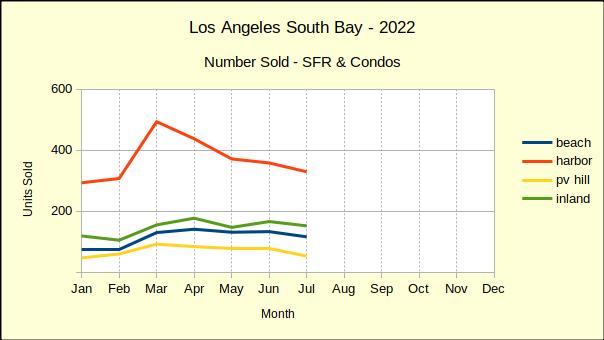
Hill: Numbers Continue to Fall
Real estate on the Palos Verdes Peninsula was off more this month than last. Month to month sales volume dropped by 14%. Median price, which was flat last month, has fallen by 1% this month. This kind of back and forth jockeying in price and volume looks jerky in the month to month statistics.
When viewed against the backdrop of annual data one can more readily see the direction. Annually, residential sales dropped by 14%, roughly the average of the past few months. While sales volume was dropping, the annual median price rose a surprising 10%.
Combining January and February for year over year numbers shows the number of homes sold increasing by 11% and the median price increasing by 9%
Inland: A Mixed Bag for Sales and Prices
Like the Beach cities, the Inland area enjoyed a huge surge in the number of homes sold for February, after suffering a large drop in sales January. Volume was up by 40% for the month. Median price dropped 4% after an 11% jump last month. So far this year the market has been very unpredictable.
As mentioned early, the “same month, last year” perspective is starting to level out. Residential sales volume for February of 2024 increased by 6% compared to 2023. The median price was up 5% over for the same period. The annual percentage of change seems almost stable by comparison the the monthly.
Year to date, Inland sales have increased 7% while the median price has declined by 1%. So far in 2024, only the Inland median price has declined from the first two months of last year.
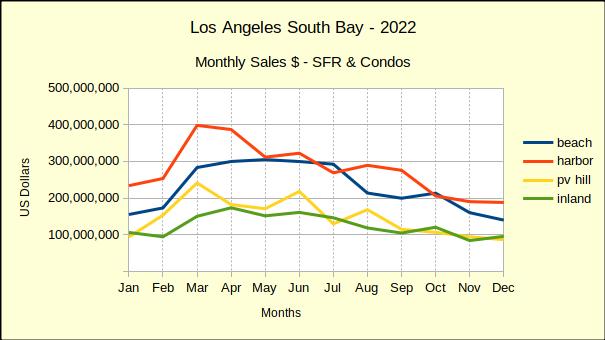
Beach=Manhattan Beach, Hermosa Beach, Redondo Beach, El Segundo
Harbor=Carson, Long Beach, San Pedro, Wilmington, Harbor City
PV Hill=Palos Verdes Estates, Rancho Palos Verdes, Rolling Hills, Rolling Hills Estates
Inland=Torrance, Lomita, Gardena