Home Sales Volume
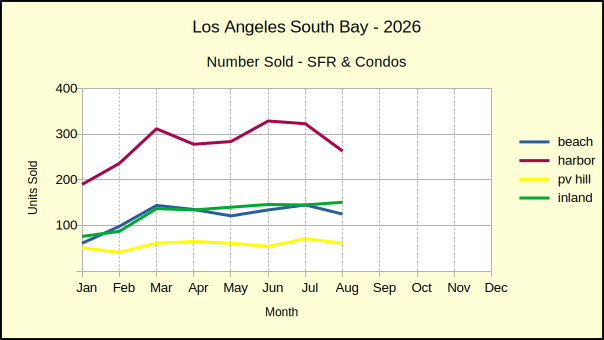
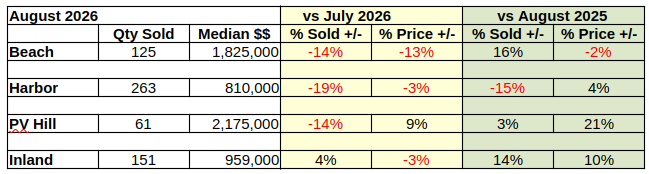
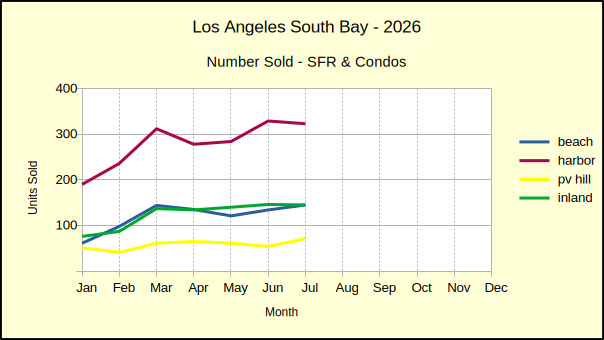
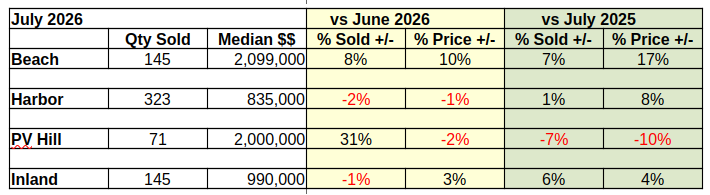
The number of South Bay homes sold in September increased over August by 3%. However, compared to September of 2025, current sales were down by 4%. This year has been volatile, with four out of nine months showing fewer sales than the prior month.
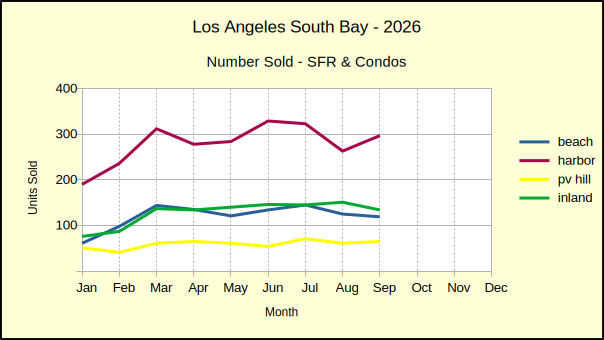
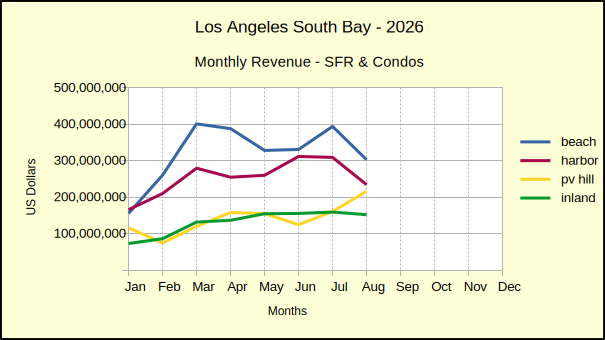
The Harbor and Inland areas, combined, comprise 70% of the homes sold in the South Bay. Those two areas are the more stable of the region, while the Beach and Hill sales statistics can vary wildly from month to month. Starting in April, sales started showing increased stability, in tandem with slowing sales. As the year has progressed, the bulk of transactions have displayed smaller differences and more of tendency to erratic movement.
Year to date, through the third quarter, home sales are off by 3%. The Beach cities continue to show the strongest sales growth of the Los Angeles South Bay. Despite being down 5% from August, itself down 14% from July, the year to date sales are still up 9% at the Beach. Both the Harbor and the PV Hill areas showed a decline in year to date activity. The Inland area came in with 0% change for the first three quarters.
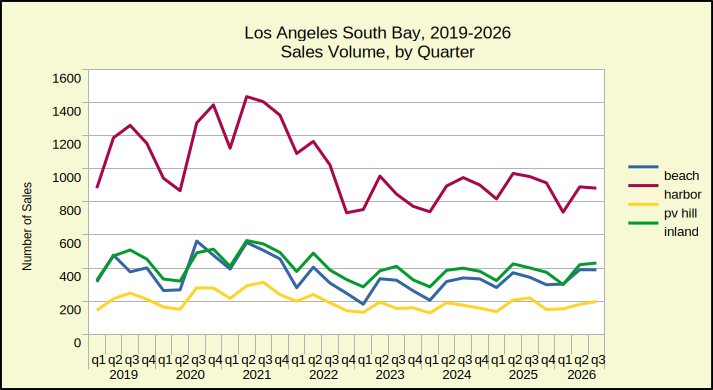
So far in 2026 the number of homes sold in the South Bay is 18% below what was sold in 2019. Judging from the direction sales figures have been moving in recent months, the region as a whole should end the year with fewer home sales than the 2019 baseline for the second year in a row.
Home Prices
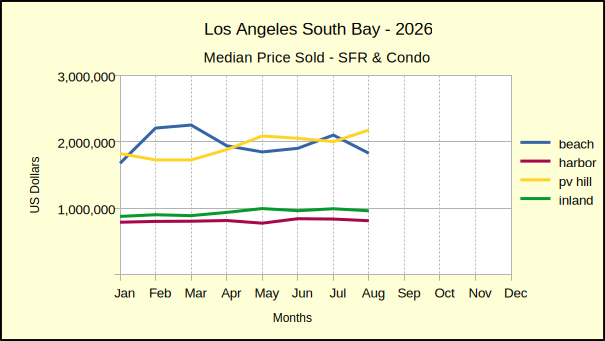
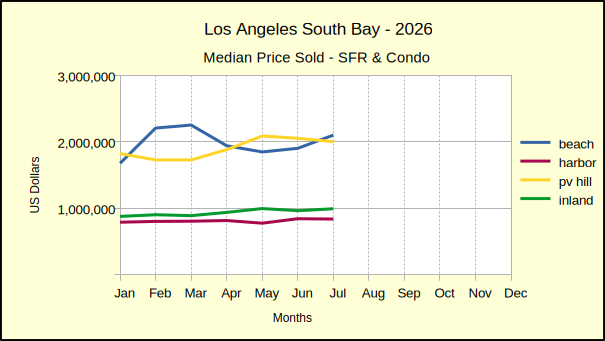
While the number of homes selling has slowed, and in some cases dropped below last year, median prices have done pretty much the same. The process has been slow, but steady. In January both the Beach and the PV areas had a negative median price. For each of the next three months of the year only one area out of the four showed a decline in median price. Each month it was a different area that dropped, too. Then in August three of the four areas fell into price decline. Once again, the areas were mixed and all areas were touched by month to month median price declines.
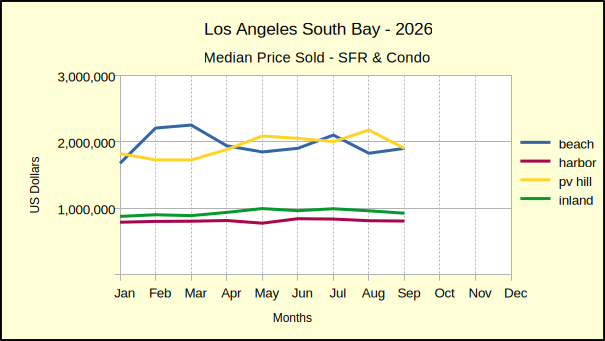
Using year over year, or same month last year, comparisons show a more scattered but very similar pattern. September brought falling median prices in every area except the Harbor, which managed to eke out a 1% increase.
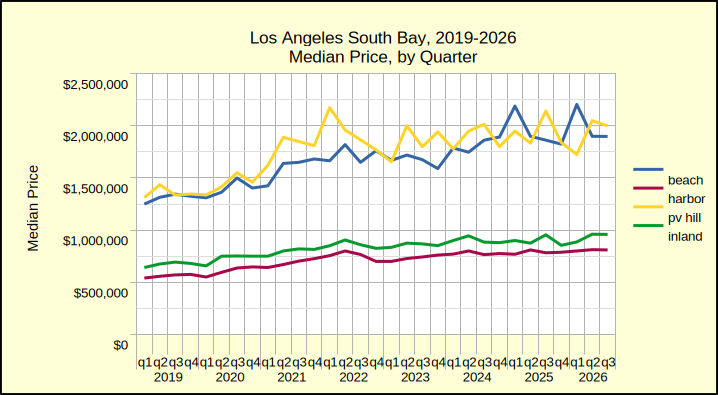
Year to date statistics at the end of the third quarter show the Beach and Palos Verdes areas with 3% and 2% declines, respectively, in median price. In opposition, the Harbor and Inland areas came in with 3% and 4% increases as of the the third quarter. There are still three months left in the year, so things could flip back to a positive market, but at this stage median prices appear to be in trouble for 2026.
Looking ahead
Make no mistake about it, the economic future we are looking at, is and will be, the result of the world economy. No matter one’s perspective prior to the US/Israel attack on Iran, today’s reality confirms the breadth of impact events on the other side of the world have on our economic situation.
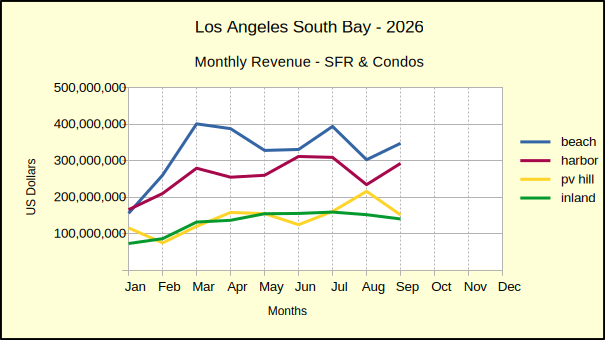
As of this writing, the world still has several elections to conduct, several wars to conduct, and a recession to weather. Terming it “stag-flation” or “infla-cession” is somewhat irrelevant. In either case, the end result for the person in the street, may literally be whether or not they live on the street. To a great extent, the fact you have a roof over your head is calculated as somewhere in the realm of 30% to 50% of the local economy. Think about it. Doesn’t your rent/mortgage/maintenance cost represent about that percentage of your income?
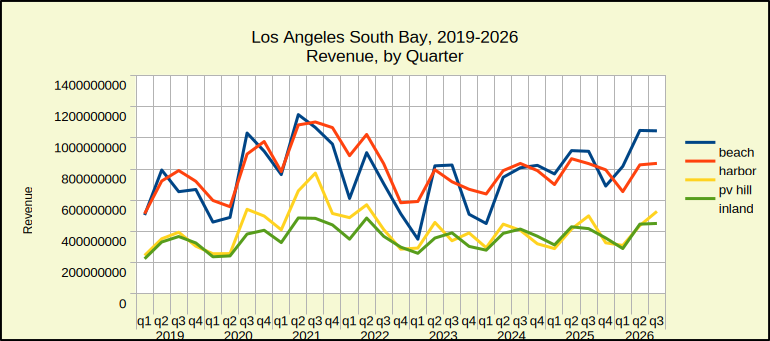
Let us not digress. The world will move on and as it changes we will adjust—much more slowly than the headlines would like to show. If I assume the fourth quarter will look just like last quarter. (I realize that’s incredibly optimistic since the final quarter the year is often the weakest.) But for the sake of forecasting, if we make that assumption and plug in the raw numbers, we end the year with a flat market across the South Bay in terms of number of units sold. At the same time, the median price reflects low single digit growth for all areas. That would be a positive projection for the final report of the year. The trend for the moment seems to be aimed somewhat lower though. Let’s see what happens over the final quarter.
Stats for the Detail Minded
Beach:
M-m, vol: 119, -5% med: 1,899,000, 4%
y-y, vol: 18%, med: -3%
ytd, vol: 9%, med: -3%
vs 2019: vol: -8%, med: 45%
Harbor:
M-m, vol: 297, 13% med: 805,000, -1%
y-y, vol: -8%, med: 1%
ytd, vol: -8%, med: 3%
vs 2019: vol: -25%, med: 45%
Hill:
M-m, vol: 65, 7% med: 1,900,000, -13%
y-y, vol: -23%, med: -11%
ytd, vol: -6%, med: -2%
vs 2019: vol: -13%, med: 45%
Inland:
M-m, vol: 134, -11%, med: 922,500, -4%
y-y, vol: 2%, med: -7%
ytd, vol: 0%, med: -2%
vs 2019: vol: -12%, med: 39%
Beach=Manhattan Beach, Hermosa Beach, Redondo Beach, El Segundo
Harbor=Carson, Long Beach, San Pedro, Wilmington, Harbor City
PV Hill=Palos Verdes Estates, Rancho Palos Verdes, Rolling Hills, Rolling Hills Estates
Inland=Torrance, Lomita, Gardena
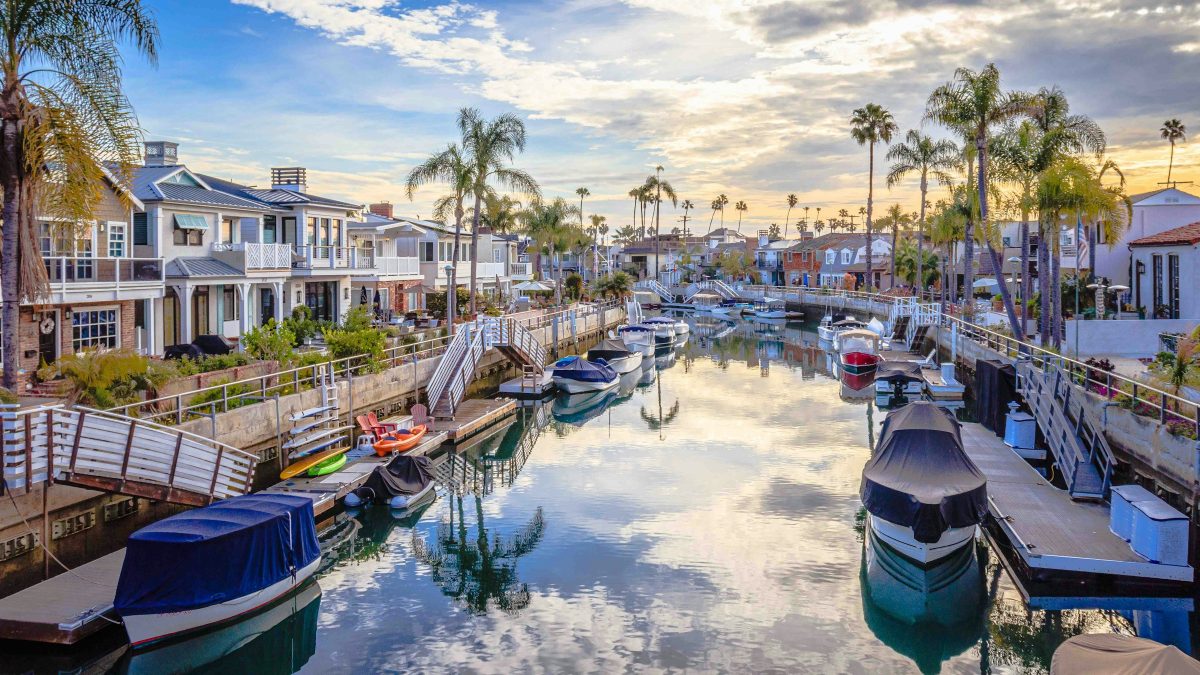
Photo by Carl Clark, Redondo Beach Sunset